PCC looks forward to July 14th –17th, 2026, when our PCC family will gather again in Winooski’s sister city of South Burlington, VT, for our annual Users’ Conference! And, if you can’t make it in person we will once again offer a virtual option so you can join us remotely from wherever you are!
PCCers and industry experts will present talks and workshops to help you pull the weeds out of your workflows, reap the benefits of new software features, and nourish the roots of your practice culture. Cultivate your friendships with other PCC practices, and maybe sprout some new ones! A garden of ideas and good times awaits you at UC 2026.
Registration is included in your Care Plan for all PCC clients with a currently active Care Plan agreement.
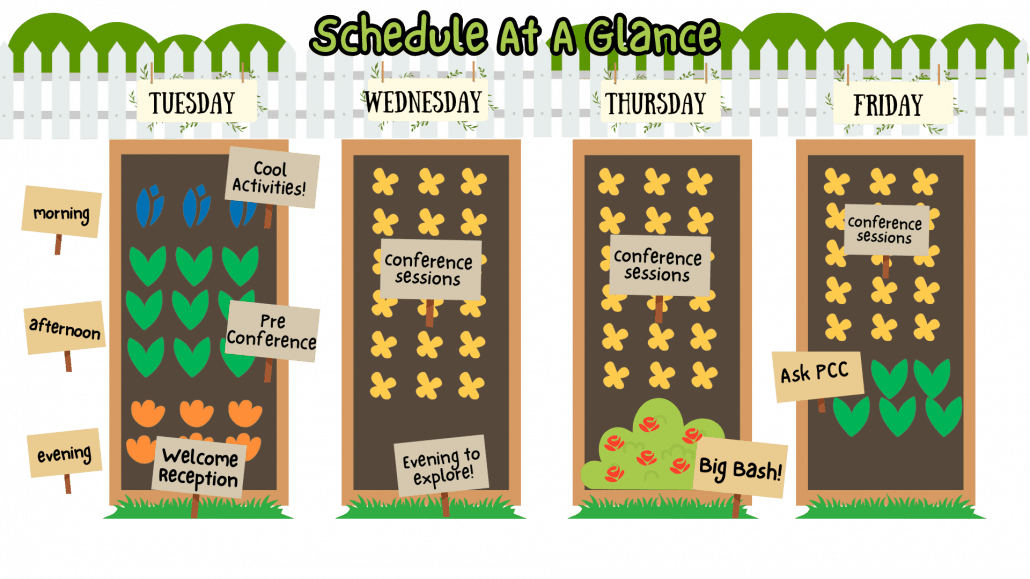
July 14th: Fun Activities, Pre-Conference, and Evening Welcome Reception
Fun Activities
Kick off your conference experience on Tuesday morning with engaging activities alongside your peers and PCC employees! Choose from a variety of options to get into the conference spirit: outdoor adventures like community gardening, a walk through Vermont’s woodlands, or visiting a local farm for pick-your-own berries; or baking and games for those who prefer to stay indoors.
Activities and sign-ups to be announced in Spring 2026
Practice Communities Pre-Conference
Get ready to plant a few seeds and dig a little deeper with a pre-conference workshop curated just for you, and your role in your practice. We’ll offer networking, discussions, and activities structured around growing leadership in these practice communities: Billers & Coders, Clinicians, Practice Administrators & Front Desk, and Practice Owners. Be sure to choose the Add-On during registration!
Evening Welcome Reception, 5:00 pm – 7:00 pm
Join us at our evening Welcome Reception from 5 pm to 7 pm, where you can pick up your UC T-shirt and bag, and mingle with fellow attendees and PCCers.
July 15th-17th: Users’ Conference
PCC’s conference officially runs July 15th-17th with our main event – three full days of courses carefully curated to help your doctors and staff navigate the challenges of delivering optimal pediatric care in an ever-shifting healthcare landscape. PCC speakers and industry experts will help you make smart decisions to support your practice’s clinical and financial health.
Daily Conference Schedule for July 15th-17th:
This year’s schedule and course descriptions will be available in Spring 2026.
Classes will be held and livestreamed from 8:30am to 5:00pm each day.
Breakfast and lunch are provided for all in-person attendees and registered guests.
Wednesday, July 15th – Evening To Explore
Take advantage of a schedule-free evening to explore the delights of Vermont in the summer! PCC will be providing shuttles to and from the Church Street Marketplace and Winooski City Center for attendees to dine, shop, and relax. Attending the UC solo and looking for some friends for the evening? Check out the Meet Ups section of the app to coordinate with others!
Thursday, July 16th – Big Bash
Join us for a magnificent Garden Party, celebrating the bounty of fields, forage, and farms!
In-person attendees and registered guests will enjoy an incredible evening at a local farm. The night begins with a beautiful meal by Adventure Dinner, featuring locally-sourced ingredients and specialty mocktails and cocktails. Guests can also interact with some of the Farm’s animals or stroll through their stunning formal gardens. As the sun sets over Lake Champlain, dance under the stars to music by Ultraviolet (Owen’s band!). Festive attire such as your Garden Party best, is encouraged, but not required.
Transportation will be provided. Cash bar. Registration is required as space is limited.
Plan Your Trip
Remember to book your room online or via phone (1-800-HILTONS (1-800-445-8667), referencing the PCC 2026 Users’ Conference as the group name) at the DoubleTree by Hilton Burlington, as well as your flight if you are traveling by plane.
The discounted rate for hotel rooms in the PCC block is $229/night plus tax. Reservations must be made by June 19, 2026. Rooms are subject to availability. Check-in time is 4pm and check-out time is 11am. If you will be arriving later, let the hotel know so they will hold your room for a late arrival. Check with the hotel if you need to check-out later to see if they can accommodate you.
Guest Registration
PCC’s Guest Registration options allow your traveling companions the choice of attending UC meals and special events, including breakfast and lunch at the conference on Wednesday, Thursday, and Friday. Guests are not admitted to conference classes. There are no extra fees for registered guests ages 6 and under. Registration fees for guests ages 7+ range from $80-$200.
Questions? Email ucsupport@pcc.com
Have questions? We’re here to help!
Loading...


